


Abstract
The exploration of icy body composition in the solar system has often involved spectroscopic measurements of volatiles detected with remote sensing, such measurements portray materials naturally expelled from the surface that enter the exosphere and potentially escape into space. Variations in the ratio of deuterium and hydrogen in these measurements have led to inconclusive hypotheses regarding potential cometary origins of Earth's ocean water and/or organics. Observational biases regarding unknown previous processing of the observable ejected materials necessitates studies of more dormant, less-processed bodies. Landed missions on comets have brought focus onto the development of small, sensitive instrumentation capable of similar composition measurements of the nascent surface and near-surface materials. We present an evolution of our compact Fourier-transform millimeter-wave cavity spectrometer that is tuned for sensitivity at 80.6 and 183 GHz where HDO and H2O exhibit resonance features. We discuss both a low-SWaP (size–weight and power) architecture that uses custom microchip transceiver elements as well as a modular configuration using traditional GaAs-based millimeter-wave hardware. New design features for these systems including quartz-based coupling elements, system thermal management, and a separable clocking board are discussed in addition to sensitivity studies and applications in potential mission scenarios.
Export citation and abstract BibTeX RIS

Original content from this work may be used under the terms of the Creative Commons Attribution 4.0 licence. Any further distribution of this work must maintain attribution to the author(s) and the title of the work, journal citation and DOI.
1. Introduction
1.1. Scientific and Measurement Background
Our understanding of the Earth, its planetary neighborhood, stars, and galaxies, largely stems from reductive analyses of components of systems, with atomic and molecular compositions forming a basic pillar of that knowledge. The detailed understanding of composition combined with chemical knowledge allows for a reductive determination of the evolution of a system as constituted by its state within a dynamical equilibrium. Additional knowledge regarding the origins of materials is gained from measurements of isotopic ratios, which trace components back to primordial sources in nucleosynthetic stellar factories or reveal the residence time of the materials in environments where kinetic isotope effects can manifest.
Key questions about the origin of our planet's water are as yet unanswered due to ambiguity regarding the sources of materials in the solar nebula. The deuterium to hydrogen ratio (DHR) on Earth is far from the solar norm, or even that found in Jupiter, Saturn, or other planets. Common solar system formation models suggest Earth's water was delivered after the early (hotter) Sun forced volatiles out of the inner solar system, likely during the bombardment periods when collisions were frequent. In this hypothesis, the Earth's DHR is inherited from objects selected (mostly by Jupiter and Saturn resonances) for injection into the inner solar system that then collided with early Earth. Many objects from this class still reside in today's solar system, particularly those lucky enough to find stable orbits and/or return after long periods out to distant trajectories. Studies made of comets (Moreels et al. 1994; Gulkis et al. 2007) reveal that water and other volatiles experience a wide variety of states, and that comets are inherently dynamic systems that must be studied in depth before accurate conclusions can be drawn. Furthermore, the community has formed a consensus that a large number of observations will be necessary to gain a statistically accurate representation of these complex objects (NASEM 2022).
Several mission concepts have been structured around achieving goals in understanding the origins and processing of water. For remote sensing of water on comets, space telescopes (Frisk et al. 2003; Tolls et al. 2004; Roelfsema et al. 2012) are required to avoid self-absorption of the features in the terrestrial atmosphere. However, these instruments had been dedicated primarily to interstellar studies and were not designed for observing and/or tracking local objects, especially not as they approach the Sun and become more active. Alternatively, we consider the probing of materials after landing on an object, both as a mobile unit (rover and/or crawler) and as a lander with sampling/return components. At the surface of an icy body, the landing and/or mobility, as well as thermal loads or drilling operations, will generate volatiles in addition to any natural atmosphere or exosphere. These volatiles, from on, or near, the surface, are high-value science targets, as they are representative of unejected cometary materials, so determination of the composition and isotopic content of the volatiles is desired. A mobile lander carrying composition sensing instrumentation could characterize both active and dormant sites on the comet surface and thus directly address questions about the extent to which dynamical processing affects DHR. An ultimate objective for landed missions is sample return (NASEM 2022); however, reliable in situ composition measurements can both have intrinsic science value as well as significantly reduce sample return risks. These include a capability to survey sites prior to sampling, as well as to monitor volatile loss during sampling. In landed missions, it is paramount that the mass and power of sensors be minimized; this allows the limited system resources to be utilized for basic survival functions and overall mission objectives.
Techniques for detection and quantification of trace gas components currently include a variety of analytical methods such as mass spectrometry and tunable laser spectroscopy. Figure 1 shows schematic representations of these techniques in relative context for gas loading (high and/or medium and/or no vacuum) and necessary active sensing components.

Figure 1. Schematic showing basic elements of semiconfocal millimeter-wave Fourier-transform molecular sensor embedded in a vacuum chamber side by side with basic elements for a tunable laser spectrometer and a quadrupole-ion-trap mass spectrometer.
Download figure:
Standard image High-resolution imageMass spectrometry plays a crucial role for coverage of composition over a broad range of constituents. For spaceborne sensing, mass spectrometers have been matched with gas chromatographs (Hoffman et al. 1980) or used to detect atmospheric gases directly (Waite et al. 2004; Goesmann et al. 2009). Challenges for mass spectrometry involve both separation of analytes to avoid overlapping spectra, as well as ambiguity caused by decomposition of species during the process of ionization. Techniques with high-enough mass-resolution to resolve spectral overlap tend to have burdensome size, weight, and power (SWaP), so miniaturized systems have been developed (Nikolic et al. 2019). Biases in sampling (separation and/or ionization) methods must be carefully considered when determining the associated properties of a given system.
Impressive progress has been made in the development of compact laser trace-gas sensors that are deployable in remote environments (Mahaffy et al. 2012). Deployable tunable laser spectrometer (TLS) systems incorporate multipass optical systems that increase the sensitivity with only modest increases in mass and volume, and highly sensitive cavity systems are routinely used in benchtop or point installations. Often deployed in high pressure (0.5–1.0 atmospheres) terrestrial environments, these sensors are relatively insensitive to pressure broadening and demonstrate mass and/or volume scalable sensitivities proportional to molecular cross sections at infrared wavelengths. Several important species with no permanent dipole moment are readily detectable by TLS, notably, CH4 and CO2. The limitations of TLS methods are associated with the magnitudes of these cross sections, as well as the uncommon and widespread origins in infrared spectra that produce only occasional overlaps of multiple species within laser bandwidths.
Recognizing the intrinsic sensitivity to gases with permanent dipole moments, we have pursued development of deployable systems capable of rotational spectrum sensing (Drouin et al. 2016; Raymond et al. 2017; Nemchick et al. 2018a; Raymond et al. 2020). Other efforts, including developments at Ohio and Wright State Universities (Medvedev et al. 2010; Lou et al. 2019), our laboratory (Drouin et al. 2012), and Dunkerque (Hindle et al. 2019; Elmaleh et al. 2023) where highly sensitive quantitative sensors at millimeter and submillimeter wavelengths utilizing absorption techniques, have been demonstrated. These methods are sensitive; however, the apparatus tend to be difficult to miniaturize, and the measurement time must be traded for frequency scanning to trace out an absorption feature. This is why we have focused on pulsed excitation methods that show promise for rapid detections in a minimal volume. For miniaturization, we have exploited the Flygare–Balle (Balle & Flygare 1981) technique (see Figure 1), often called Fourier-transform microwave spectroscopy, that was originally developed for ultra-sensitive (densities of analytes ∼106 or higher) detections of microwave rotational spectra of medium to large molecules (60–200 amu). These systems developed at centimeter wavelengths (Suenram et al. 1999) were shown to be effective for high-precision, high-sensitivity, high-selectivity characterizations of molecular rotational spectra of molecules, their isotopologues, and associated van der Waals or pre-reactive complexes. Rotational spectra, which occur for molecular species with a permanent or magnetic dipole moment, have a common origin at zero frequency, and spectra occur at centimeter (microwave, 1–10 cm, 3–30 GHz), millimeter (0.1–1 cm, 30–300 GHz), and submillimeter (0.01–0.1 cm, 300–3000 GHz) wavelengths for species of decreasing mass, where the wavelength dependence derives from the inverses of the moments of inertia. Briefly, the technique utilizes a Fabry–Perót cavity as a passive amplifier for the radiation tuned to a molecular resonance; the pulsed excitation of the gas results in a delayed free-induction decay, with little or no background noise, and magnitude proportional to the trace-gas concentration. Rotational spectra at low pressures have narrow features that are widely separated, even for isotopologues. Developments of the Flygare–Balle technique in the millimeter wavelengths [FTmmw—beyond 40 GHz (Halfen et al. 2015; Drouin et al. 2016; Raymond et al. 2017; Nemchick et al. 2018a; Raymond et al. 2020)] have been limited due to challenges associated with transmission, detection, and coupling of elements for the system. Nevertheless, these developments promise to enable access to stronger molecular resonances that scale with the cube of the resonance frequency, as well as optics that scale down with the diffraction limit. We present here a dual-band millimeter-wave system that realizes the Flygare–Balle sensing technique in a compact form factor (∼1U). The system design targets two isotopologues of water, and it is complementary to mass-spectrometric techniques and more sensitive than infrared laser sensors.
1.2. Technologies Background
The advents of microelectronic and photonic devices have enabled a new class of miniaturized sensors that encompass reasonably complex functionalities through multifunction optics and system-on-chip (SoC) developments.
The development of millimeter-wavelength SoCs led immediately to a solution to the high-frequency coupling problems for Fabry–Perót cavities (Drouin et al. 2016) since the chip, being the source of the millimeter waves, could be placed immediately adjacent to the cavity to eliminate multiple inefficient coupling steps. For efficient use of the Flygare–Balle technique, the SoCs were also designed to accommodate the frequency tuning via radio-frequency (RF) synthesis, frequency locking at <0.1 MHz precision, pulse modulation, and intermediate-frequency (IF) amplification. Concurrent commercial development of an RF SoC (Silabs 5340) with capability for supporting the transmitter, receiver, pulse duration, and pulse trigger signals reduced the burden of the custom SoCs to be developed. Subsequent generations of our millimeter-wave SoC improved the pulse isolation (Nemchick et al. 2018a) and extended the frequency range (Nemchick et al. 2018b; Kim et al. 2019; Nemchick et al. 2021). A single band system with 1 liter volume, fed with 1.1 volt system power, was demonstrated to draw <2 W during nominal operations in which pulsed molecular responses were recorded externally using a laboratory oscilloscope that operated at roughly 10% real-time signal averaging. We estimate that a field-programmable gate array (FPGA) requiring another 1W of power could replace the laboratory oscilloscope and improve the sensitivity with real-time averaging.
The demonstration of a low-SWaP method of sensitive detections via the Flygare–Balle technique motivated us to target the next generation system for the achievement of landed surface mission goals associated with the sampling of water and deuterated water. An immediate challenge was noted regarding the demonstrated 10% bandwidth and the significant distance (in frequency space) between resonances. Since there are no strong millimeter-wavelength HDO features within 10% of an H2O feature, we set to develop a dual-band design that utilized a four-port cavity coupler and implements separate chip-sets for HDO and H2O stimulation and detection.
2. Materials and Methods
The dual-band Fourier-transform millimeter-wave systems described here are composed of transmitters, receivers, RF circuitry, millimeter-wave couplers, semiconfocal Fabry–Perót cavities, thermal sinks, and custom electronics, as well as supporting commercial electronics. In this section, we describe the components utilized for two different systems, one a point design with low SWaP, the other a modular system with custom and commercial off-the shelf (COTS) parts.
2.1. RF Systems
Modern CMOS chips are capable of generating and detecting millimeter-wave signals through balanced circuit designs employing varactor principles (Tang et al. 2012). Here, we implement circuit elements shown to be effective for W band (70-110 GHz) in 65 nm CMOS architectures as wells as for G band (160–210 GHz) in 28 nm CMOS architectures. The basic designs of both transmitter and receiver devices at these bands have been described in prior literature and will not be discussed at length here; instead we provide the salient details required to understand the system as it is interconnected, as well as tabulate the performances of the components (see Table 1).
Table 1. Component Reference Data
| Component | Range (GHz) | Performance | Notes |
|---|---|---|---|
| Tx (W) | 90–102 | 4 mW | 20 dB switch isolation |
| Tx (W) | 80–85 | 5 mW | 24 dB switch isolation |
| AMC-10 | 75–110 | 10–200 mW | with JPL amps |
| Tx(G) | 177–190 | 1 mW | 18 dB switch isolation |
| D160 | 150–170 | 50 mW | with JPL amps |
| D180 | 170–190 | 35 mW | with JPL amps |
| D200 | 190–210 | 20 mW | with JPL amps |
| T300 | 270–330 | 5 mW | with JPL amps |
| WR10FM | 75–110 | 1000 K | conversion loss 8 dB |
| WR5.1SHM | 140–220 | 500–1000 K | conversion loss <7.5 dB |
| Rx (W) | 90–102 | 1500 K | |
| Rx (W) | 80–85 | 1500 K | |
| Rx (G) | 175–190 | 10,000 K | |
| WR10ZBD | 75–110 | 2800 V/W | NEP 9.4 pW/Hz1/2 |
| WR5.1ZBD | 140–220 | 2400 V/W | NEP 11 pW/Hz1/2 |
| WR3.4ZBD | 220–330 | 2200 V/W | NEP 12 pW/Hz1/2 |
Note. NEP = noise equivalent power.
Download table as: ASCIITypeset image
The prior developments of W-band CMOS elements provided our first-generation system (Drouin et al. 2016; Raymond et al. 2017; Nemchick et al. 2018a) that operates from 90 to 102 GHz. The system demonstrated 10% bandwidth (relative to center of each band) and sensitivity, comparable to research grade instrumentation at similar wavelengths (Drouin et al. 2005; Neill et al. 2013). For sensitivity to specific compounds, the matched transceiver elements must be tuned for coverage over sufficiently strong natural resonances of the target compounds. For DHR science goals, we target an HDO resonance at 80.5 GHz with room-temperature linestrength of 10−3.7 nm2 MHz (Pickett et al. 1998). Here, the transmitter and receiver elements were redesigned with a lower-frequency range for the varactor circuit, while keeping phase-locking and pulsing elements fixed, except for certain integer multiples in the locking circuit. Two iterations of the retuned varactor circuit resulted in a 5% bandwidth system with sufficient transmitter, Tx (W), power (5 mW) and receiver, Rx (W), and sensitivity (1500 K) covering the HDO resonance.
Our developments of 28 nm CMOS elements for transmission and detection of radiation near the 183 GHz resonance of H2O (with linestrength of 10−3.6 nm2 MHz; Pickett et al. 1998) have been published directly by Kim et al. (2019), Nemchick et al. (2018b, 2021). The same chips are used in this system without further development except for insertion of a pulse modulator and placement onto different custom circuit boards. We note that, for efficiency, G-band circuit element couplings off-chip are differential (AC). The prior efforts each utilized custom differential waveguide probes. In this development, the direct coupling of a differential output chip-set to a cavity system required significant redesign of the CMOS system specific G-band coupler elements.
For component and modular system testing, multiplier-chain-based techniques for the generation (Drouin et al. 2005) and detection of millimeter waves and other basic research tools were utilized. These systems comprise high-fidelity RF synthesizer sources such as Agilent signal generators and phased network analyzers. Pulse modulation is performed internally at the synthesizer, or with the RF signal using in-line Q-switches such as the DBWave PASA0102001800A. The RF signals are multiplied using first a Millitech AMC-10 unit for generation of W-band radiation, and may be doubled using a Virginia Diodes D180 or D200 for G-band operation. A custom JPL-built 300 GHz tripler was also used in conjunction with an AMC-10 unit to identify the full range of the modular system. For the detection of radiation, we implement zero-biased detectors (ZBDs), fundamental mixers (FM), subharmonic mixers (SHM), and power meters. Virginia Diodes ZBDs for 140–220 GHz (WR5.1ZBD) as well as for 220-330 GHz (WR3.4ZBD) were utilized to detect the rapidly scanned source radiation for video detection of cavity modes through the display of detector output on an oscilloscope. This configuration was highly useful for cavity characterization and alignment. For detection and down-conversion of molecular free-induction decays, Virginia Diodes WR10FM was used in W band, and WR5.1SHM was used in G band. The intermediate-frequency signals were amplified with Mini-Circuits ZFL-500LN+, and filtered with Mini-Circuits SLP-150+ and SHP-25+ prior to digitization and data collection with a DPO5104B oscilloscope.
2.2. W-/G-band Couplers
The central component of each our systems is the planar coupler element that allows millimeter-wave radiation to pass along a feedline into the central cavity region defined by the cylindrical axis of a semiconfocal resonator cavity formed by the coupler plate and an associated spherical mirror. While traditional microwave and laser cavity resonators utilize fully confocal cavities, there has been no viable back-fed mirror-coupling strategy at millimeter wavelengths, so we adopted the semiconfocal configuration to allow for stripline feeds and antennae structures to be imprinted into the planar mirror using standard RF engineering techniques.
Prior developments at W band (Drouin et al. 2016; Raymond et al. 2017; Nemchick et al. 2018a; Raymond et al. 2020) utilized a simple feed line on gold-plated Duroid, the feedline terminated near the plate center, which was separated from the plate perimeter with extended gaps perpendicular to the feedline. Judicious placement via holes, which allow electromagnetic field lines to couple through the substrate in specific locations, was optimized through simulation tools. The placement of the feed strip ends at different distances from the plate center was shown to trade the throughput for mode isolation (Nemchick et al. 2018a), factors that offset for system molecular sensitivity when the transmitter power is not at the quantum limit. This original design was lossy, but supported moderately high Q modes (∼4000) when optically coupled within a Fabry–Perót cavity. In a modular system, component testing with higher-frequency transceiver (G-band) components indicated a maximum transmissible frequency of 144 GHz.
For the present development, several modifications to the coupler design were incorporated to (1) improve the throughput while minimizing loss of isolation (preserving Q); (2) improve high-frequency operation; (3) incorporate two bands onto a single coupler. The initial testing of coupler designs was done in a modular system utilizing waveguide probes for direct coupling of radiation from a waveguide. These single-feedline designs were updated with a split double slot radiator pattern with two adjustable parameters for optimization in each band. One parameter was similar to the earlier design and allowed variation of the distance from the coupling element to the center of the plate; the other parameter was associated with the dipole length (see design elements depicted in Figure 2). Simulations proved that these designs, along with via holes encircling the dipole elements, were able to optimally couple cavity modes in a resonator. These modes do not require a constructive overlap in the center of the plate and attain a larger volume for the gas phase interaction.
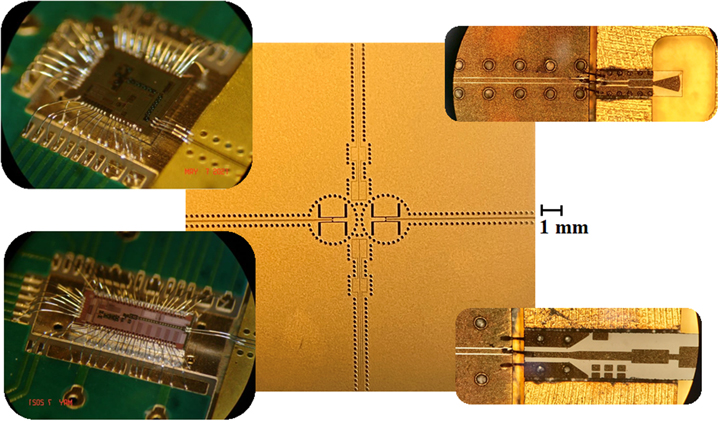
Figure 2. Center: photograph of dual-slot W-band coupler (horizontal) and dual-patch differential G-band coupler (vertical) used for low-SWaP system, 1 mm scale bar given. Inset microphotos: (lower left) G-band CMOS Rx , (upper left) W-band CMOS Rx , (upper right) G-band waveguide probe, (lower right) W-band waveguide probe.
Download figure:
Standard image High-resolution imageMillimeter-wave components made with Duroid substrates are known to have significant losses above 150 GHz; therefore, to operate effectively in G band (140–220 GHz), these couplers were constructed on a substrate composed of a 0.254 mm thick plate of fused silica. Like the Duroid couplers, 5 μm thick gold plating comprised the conductive elements.
For implementation of a modular dual-band system, the W-band coupler elements and G-band coupler elements were each placed on adjacent sides across from their in-band counterparts. This geometry allows W-band mode structures to couple in (say) the horizontal direction while G-band mode structures couple in the perpendicular (vertical) direction. W- and G-band probes for waveguide to coupler connection were implemented using designs optimized for G-band receivers in prior work (Kim et al. 2019); these are shown also in Figure 2.
The dipole coupler elements in the single-feed line system described above are incompatible with the G-band CMOS chip outputs. Therefore, a differential coupling design was modeled and fabricated specifically for use in the low-SWaP system. For effective differential coupling, a serial patch design with variable dimensions between and within patch structures was modeled, and a design with good modeled coupling near 183 GHz was selected. Since the W-band chip-set did not require differential coupling, only the G-band elements were replaced in the dual-band coupler design. The fabrication of these couplers was done in the same fashion as the dual-band coupler for the modular system. The design for the G-band differential coupler is also depicted in Figure 2.
Similar substrate material changes were required in waveguide coupler elements (upper right and lower right insets to Figure 2) to reduce insertion losses for CMOS-to-waveguide and for waveguide-to-coupler plate transitions.
2.3. Semiconfocal Fabry–Perót Cavity
The tunable Fabry–Perót cavity was implemented in the same fashion as prior work (Drouin et al. 2016; Nemchick et al. 2018a) utilizing a 50 mm diameter, 50 mm radius of curvature, gold-coated spherical mirror attached to a Physicalich Instrumente (PI) piezo-electric unit with 15 mm linear travel and 300 nm precision. The dual-band mode coupling was observed to be somewhat independent with each band depending critically on the centering of the mirror optical axis in the plane of the respective coupler feedlines. Based on cavity length (50 mm) and wavelengths (80.5 GHz for HDO, λ = 3.7 mm, 183 GHz for H2O, λ = 1.6 mm), the cavity free-spectral range is around 3 GHz for each band.
2.4. Custom Electronics
Two custom circuit boards were designed for operations of the low-SWaP dual-band system. Prior work had focused on streamlined single board designs that minimized SWaP; however, the need for two SiLab circuit elements, and the need for (at least) two sets of supporting command and control electronics, drove us to develop a separate circuit board dedicated to RF syntheses. This board consists of two separable RF units, each one capable of generating the Tx and Rx lock frequencies (integer multiples of the millimeter-wave frequencies), the pulse clock timer (which sets the step-size for pulse widths), and the trigger. To match the desired trigger cadences for the Flygare–Balle technique, the SiLabs dedicated trigger output is routed through a divider circuit that extends the low-frequency range output down to 10 kHz. The remaining board, featuring the coupler plate, necessarily contains the custom CMOS chips as well as supporting microcircuitry. Both boards utilize a common architecture of Atmega and USART chips that allows for command, control, and readout of control voltages and other parameters. Customizable firmware is loaded onto the Atmega chips associated with each band, and these allow for start up in a known state as well as for simple command and/or control interfacing.
2.5. Thermal Management
Operation of electronics in vacuo often requires heat dissipation to avoid component failure. The custom CMOS components and supporting electronics operate at 1 to 1.2 V, where a significant amount of the supplied 5V power is dissipated in the various voltage regulators. Similarly the modular active millimeter-wave components (AMC-10 s in particular) dissipate several Watts of heat. On the benchtop, the AMC-10 units functioned nominally, but the coupler circuit board was hot to the touch, and the internal temperature sensors in the SoCs read maximal values. The custom boards were functional in this warm state; however, at operational pressures below 100 mTorr, there were occasional, spontaneous reboot events of the command and/or control units.
For CMOS operations en vacuo, we designed a custom thermal sink that spanned the breadth and depth of the coupler circuit board, and contained matched extrusions of the dimension of each regulator. The designs were 3D printed in aluminum and affixed to the coupler boards using thermal glue (Solithane 113 with aluminum oxide). Copper strips affixed to the thermal sink are routed to a base-plate for conductive routing of the dissipated power.
For AMC-10 operation below 100 mTorr, the aperiodic output dropouts were curtailed by installing copper strips affixed to the components and to bulkheads of the vacuum chamber.
2.6. System Integration
The two systems were built up on the benchtop while performing component testing where feasible at each step. Both systems are also accommodated in a vacuum chamber equipped with pressure gauges, high-speed vacuum pumps, and a gas-inlet port.
The modular system (see Figure 3, right) was assembled with minimal waveguide components using standard flange interfaces, SubMiniature version A (SMA), electrical (DC), and thermal connections to supporting hardware. The spherical mirror was slot mounted onto the PI with a small gimbal to allow for fine alignments. The PI was mounted to a cage-rod assembly for gross translation and rigid connection to the custom waveguide and coupler assembly.

Figure 3. Left: assembly of low-SWaP system on benchtop; heat straps not shown. Right: assembly of the modular system. The millimeter-wave transceivers are outlined in red; the central coupler plates in both systems are 2 × 2 cm2.
Download figure:
Standard image High-resolution imageThe low-SWaP system (see Figure 3, left) was assembled with the RF circuit board isolated on the cage-rod assembly near the base-plate, and a second cage plate was placed over this circuit board to isolate it from the coupler board and to provide a flat-rigid surface for the spring-mounted coupler board. Before placement of the coupler board, the thermal sink was attached with thermal straps extending out the open areas available in the cage-rod assembly. After placement, ample slack was given in the thermal straps before affixing the ends to the base-plate; this slack allows for fine alignment of the coupler element (tip and/or tilt) with the spherical mirror attached (without need for a gimbal) onto the PI stage attached also to the cage-rod assembly. Both circuit boards are connected to an Universal Serial Bus (USB) hub and 5V power supply, and flexible SMA cables are utilized to bring the necessary frequencies from the RF board to the coupler board.
Cavity alignment procedures differed for each system, with more versatile frequency tuning available for the modular system. In the modular system, the placement of a Schottky ZBD in the receiver position enabled the system alignment procedures through oscilloscopic display of the detector signal while ramping the synthesizer frequencies at video rates. The Analog Modules pre-amplifiers (12.5 kΩ input impedance) on the ZBD provided 0 to −1 V signals on the oscilloscope that could be evaluated for magnitude and/or throughput, symmetry, and bandwidth. Frequency sweeps could encompass entire bands, a single free-spectral range of the cavity, or just a single mode, depending on configurable parameters. For the CMOS system alignments, a macro program for periodic mirror translations (dithering) was loaded into the software for the PI; fixed tuning points of each CMOS transceiver were then monitored at audio rates on an oscilloscope, with ranges limited to one free-spectral range for practical refresh rates of scope traces. For better characterization of the CMOS transceiver baseline, a rectifier is installed on the IF line to convert this ∼100 MHz to a unidirectional (DC) signal.
Adjustments of the CMOS circuit board tip and/or tilt (with respect to the translating spherical mirror), or the modular system gimbal mount tip and/or tilt, as well as translations in slotted angle bracket holders for the mirrors, were performed while monitoring mode patterns in real-time on the oscilloscope. It was found that optimal optical coupling to one band (either W or G) resulted in significant mode deterioration in the other band. For this reason, dual-band optimizations (i.e., monitoring both mode patterns simultaneously) were performed that achieved acceptable mode quality in both bands in one alignment position. We estimate that about half of the optimal single band optical throughput is achieved in these configurations.
A vacuum accommodation is achieved through insertion of the assembled units into a vacuum chamber while external feedthrough connections are routed through vacuum flanges one at a time. For the modular system, the SMA feeds for the AMC-10 units, and the IF outputs, the PI command and control line, as well as the active component powers, were all routed through flanges. For the low-SWaP system, the USB hub was placed in vacuo, and thus, only one USB vacuum interface was necessary, along with 5V power, the IF outputs, and the PI command and control line. In both systems, the base-plate was thermally strapped to a bulkhead inside the vacuum chamber.
Gases are introduced through a 1/4'' or 3/8'' feed line from either a gas bottle regulator or a vaporized liquid behind a needle valve. For the best control of the sample pressure, the full speed of the pumping system was reduced to minimize any pressure gradients. The low-SWaP system pressures are read out using a 1 Torr range capacitance manometer (MKS) with stated uncertainties in the 0.25 mTorr range. For determinations of system sensitivities to particular gases, we flow pure gas into the vacuum chamber at a variety of (slow) flow rates and record both the free-induction decay at optimal excitation (pulse width), as well as the steady-state pressure of the pure gas. These measurements enable a curve-of-growth estimate of the sensitivity to a given resonance, the slope of which, when extrapolated to the noise level, provides the sensitivity (limit of detection, hereafter LoD) in pressure units. The resonance intensities are temperature dependent, so we performed all measurements at room temperature; the sensitivities are generally higher at lower temperatures for light molecules in the millimeter wavelengths.
Figure 4(a) shows a typical G-band measurement of H2O with and without background removal. The sharp ring and sloping baseline in the free-induction decay are due to transient circuit element responses and do not manifest in the Fourier-transform spectrum. For CMOS elements, the limited isolation of the transmit radiation, as well as radio-frequency interference (RFI) from the communications elements, during the measurement of the free-induction decays results in avoidable narrow-tones in the Fourier-transformed data. The modular system (data in Figure 4(b)) has great isolation and no radio-frequency interference (RFI); a bandpass filter prior to the IF amplifier removes most of the low-frequency circuit response.

Figure 4. Left: free-induction decay and Fourier-transform spectrum, with and without background subtraction, measured with the low-SWaP system. Leakage from the CMOS pulse switch and radio-frequency interference from the USART are well separated from the target measurement. Right: free-induction decay and Fourier-transform spectrum measured with the modular system over frozen ice sample.
Download figure:
Standard image High-resolution image3. Results
3.1. CMOS Elements
Due to the relatively new circuit designs and the necessary pushing of the limits of CMOS capabilities, some variability among the chip-sets was expected. Enough chips were fabricated to fully assemble five complete coupler boards, and each component was tested for bandwidth through the monitoring of a divided-down (/16 for W band, /32 for G band) signal provided as an optional output. Each of the five chip-sets were tested for lock-performance, and a few chips were found to have limited bandwidths. One of several boards with broad bandwidth for all chips was selected for a full system integration and test; all of the low-SWaP system results are based on that chip-set. The bandwidth of this chip-set is 80–84 GHz for W band, and 177–193 GHz for G band. Due to the nature of the chip-sets being embedded in a system intended for complex purposes, no clean diagnostics of individual chip powers or sensitivities can be determined; however, we have no reason to expect performances to be significantly worse than those reported in Table 1, which are typical values.
3.2. Coupler Performance
The modular coupler system was tested in both W- and G-bands using a phased-network analyzer (PNA) capable of measuring reflective and transmissive losses in both directions. PNA tests were done with and without an aligned spherical mirror that enables tunable narrowband transmissions. Reflection and transmission without the mirror essentially coincided with measurements with the mirror, but away from resonant wavelengths determined by the mirror-coupler lateral distance. Measurements were performed with the mirror at variable distances to trace out the transmission profiles across the respective bandwidths, and to determine if the quality factors (Q values, or widths of resonances) were significantly frequency dependent. The results of these tests are summarized in Table 2 and indicate reduced reflection loss and increased transmission in W-band versus the first-generation couplers. The insertion losses are slightly better than the predicted performance based on the design model, whereas the quality factors are somewhat lower than expected. The reduction in Q for this design is likely due to the improved transmission, which limits the isolation of the energy resonant in the cavity. As mentioned in the introduction, these coupler parameters are tradeable in system designs as long as the transmit power is insufficient for saturation; this system allows for the testing of that limit, and those tests will be described later.
Table 2. Average Values of S-parameters across PNA Bands with (on) and without (off) Mirror
| Band | S11, | S12,S21 | Q | f | |
|---|---|---|---|---|---|
| S22 | (off, avg.) | (on, max) | |||
| W (old) | −3 | −34 | −13 | 2000–6000 | 71–214 |
| W (new) | −5 | −33 | −12 | 800–2200 | 29–78 |
| G | −8.5 | −20 | −10 | 3000–5300 | 47–83 |
Note. The Skk parameters are reflections back to input port k; the Skj , j ≠ k parameters are transmissions from port j to port k. No significant differences in forward and reverse measurements were seen. Q-factor ranges are for dominant mode patterns, presumed to be TEM00 for W (old) and TEM10 for W (new) and G. Finnesse (f) ranges are given for base cavity lengths of 50 mm.
Download table as: ASCIITypeset image
The performance in G band followed the opposite path, with transmissions lower and quality factors higher than those of the model designs. Although the Q-factors of 3000–5000 achieved in G band are higher than expected, producing modes about 40 MHz, or 320 nm, wide. Given the PI tuning limitations, these modes are borderline adequate for reproducible, stable, mirror positioning. These mode widths are also much larger than natural (Doppler) or transit-time broadened gas features (≤1 MHz) such that the full excitation of the molecular resonances is straightforward. The operations of the modular system conformed to the expectations set forth by these PNA measurements, such that the regular mode patterns could be easily predicted after the initial alignment and system warm-up.
The coupler performance for the differential coupler was not systematically determined due to the limited range of the CMOS elements and the time and programming associated with the broadband continuous tuning of the chips. The modes show sufficient transmission for molecular excitation, and the coupling is strong enough to saturate the G-band receiver, which is best operated with the input gain reduced. The quality factors are comparable to those in the single-feedline W-band coupler.
3.3. Sensitivity Measurements
The dual-band system was developed specifically for sensitive detections of H2O and HDO, and we performed systematic measurements of controlled samples to directly determine system performance. However, the bandwidth associated with each band provides for the full exploration of the system sensitivity to a number of volatile compounds. An example set of CMOS sensitivity measurements and the curve of growth are given in Figure 5. Here, we tabulate the results for each band, providing also the chosen resonance intensities at room temperature.
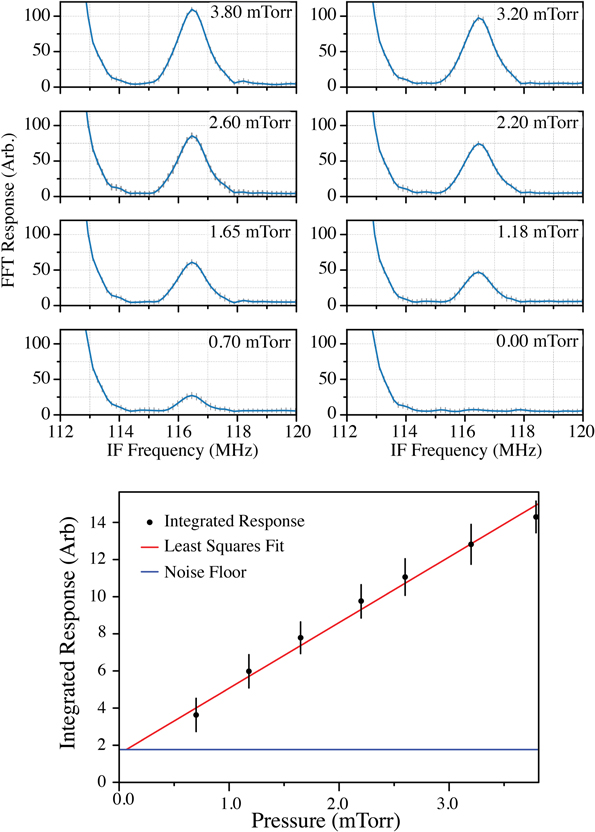
Figure 5. Curve of growth measurements for partially deuterated water, HDO; each spectrum is a Fourier-transform of 100,000 free-induction decays.
Download figure:
Standard image High-resolution imageThe LoD results for a single molecule with multiple target resonances are ideal for the determination of band-wide variability in the instrument sensitivity like those given in Figure 6. The measurements made with about 5 mTorr carbonyl sulfide (OCS) and 4000 averaged waveforms show signal-to-noise ratios (S/Ns) of over 300–750 for main isotope signals in W band and over 60–200 in G band. Because each measured transition has a different sensitivity due to the natural intensity and isotopic abundance variations across the rotational band (Iab), we derive the pressure sensitivity limits per unit cross section with our instrument model. The invariance of LoD can be interpreted with a simple instrument model, i.e., one that does not account for power or quality factor trends across a band or suboptimal matching of excitation pulse width. Here we compare OCS features, which would all have nearly identical optimal excitation conditions. Since the main-isotopologue features of OCS are sparse, we include also noisier measurements made of vibrationally excited OCS and/or isotopically substituted OCS; these points are shown in Figure 6 with the error bars inversely proportional to the isotopic abundance. The chart shows that the sensitivity is within a factor of a few, compared to more conservative values from the curve-of-growth method given in Tables 3 and 4. The highest S/N measurements imply a trend of higher sensitivity in the band center (ca. 95 GHz) versus the band edges.

Figure 6. Measurements of minimal detection limits of carbonyl sulfide (OCS), and its isotopologues, provide a diagnostic tool to assess both the sensitivity and the bandwidth. OCS features in each isotopologue appear every ∼12 GHz; these measurements extend to the last measurable features on either side of the band. Error bars are based on isotopic abundance; labels indicate isotopologue; 622 ≡16O12C32S; values in parenthesis are ν2 (bending mode) quanta.
Download figure:
Standard image High-resolution imageTable 3. Sensitivity Measurements of Chosen Volatiles in W-band Region for the Modular System, Denoted by Commercial Off-the-shelf (COTS) Parts and High- and Low-frequency CMOS Systems
| Gas | Freq. | log(Iab) d | Sens. (mTorr) | |
|---|---|---|---|---|
| (GHz) | (nm2MHz) | COTS | CMOS a | |
| SO2 | 77.9 | −4.8 | ⋯ | 0.2 |
| C2H5CN | 78.2 | −3.9 | 0.12 | 0.12 |
| C5H5N | 79.9 | −4.3 b | 0.05 | 0.04 |
| HDO | 80.5 | −3.7 | 0.05 | 0.04 |
| C3H6O | 81.8 | −4.7 | 0.4 | 0.3 |
| OCS | 85.1 | −3.8 | 0.016 c | |
| CH3CN | 91.7 | −3.2 | 0.02 | 0.0005 |
| OC34S | 94.9 | −5.1 | 0.1 | 0.050 |
| CH3OH | 95.1 | −4.4 | 0.08 | 0.013 |
| OCS | 97.3 | −3.6 | 0.005 c | 0.003 |
| OCS | 109.5 | −3.5 | 0.007 c | |
Notes.
a Upper portion of table is new custom CMOS system; lower portion is former CMOS system. b Intensity of blended multiplet. c Additional measurements of OCS vibrational states and isotopologues were made with a different method; these data and are shown in Figure 6. d Includes isotopic intensity correction.Download table as: ASCIITypeset image
Table 4. Sensitivity Measurements of Chosen Volatiles in G-band Region for the Modular System, Denoted by Commercial Off-the-shelf (COTS) Parts and CMOS Systems
| Gas | Freq. | log(Iab) a | Sens. (mTorr) | |
|---|---|---|---|---|
| (GHz) | (nm2MHz) | COTS | CMOS | |
| OC33S | 168.1 | −5.07 | 2.9 | |
| OCS | 170.3 | −2.95 | 3.4 | |
| CH3OH | 181.3 | −4.1 | 0.06 | |
| O13CS | 181.8 | −4.9 | 1.7 | 0.17 |
| OCS | 182.4 | −2.9 | 0.3 | 0.03 |
| 18OCS | 182.5 | −5.6 | 3.7 | |
| H2O | 183.3 | −3.6 | 0.05 | 0.11 |
| CH3CN | 183.9 | −2.2 | 0.004 | |
| SO2 | 185.0 | −3.15 | 0.21 | |
| 17OCS | 188.3 | −6.30 | 14.8 | |
| OC34S | 189.8 | −4.23 | 0.18 | |
| OC33S | 192.1 | −4.92 | 0.36 | |
| OCS | 194.6 | −2.81 | 0.04 | |
| O13CS | 206.1 | −4.74 | 0.85 | |
| OCS | 206.7 | −2.74 | 0.16 | |
| OC33S | 216.1 | −4.80 | 0.50 | |
Note.
a Includes isotopic intensity correction.Download table as: ASCIITypeset image
We define an instrument response (referred to here as a figure of merit, hereafter FoM*) with respect to a unit cross section (e.g., an FoM* = 2 nTorr nm2MHz and a cross section of Iab = 10−3.6 nm2MHz correspond to a minimum pressure sensitivity of FoM*/Iab = 8 uTorr). An inspection of the data for heterogeneous gases shows more variability in comparison with this simple model, with variability in the ×1 to ×7 range for the gases listed in Table 3. For sensitivity measurements in G band, significant variability is also observed within a molecular carrier, specifically for the strongly absorbing OCS main isotope, which exhibits nonlinear instrument noise in these measurement conditions. The values for minor OCS isotopologues are consistent with the relatively sparse heterogeneous measurements and provide an FoM* for G band of 12 nTorr nm−2MHz. Although there is no designed or physical reason for each band to have similar sensitivities (the FoM*s are within the observed heterogeneous variability), we believe the individual band sensitivities are dependent upon design factors that vary between bands that can have compensating effects. The FoM* values derived here are determined by finding the median in all of the measured molecular LoDs presented in these tables.
3.4. Sensitivity Model
Using the individual measurements based on system performance, we can make generalized statements about the sensitivity of the instruments to compounds with known rotational transitions, such as those listed in the JPL Spectral Line Catalog (Pickett et al. 1998) and the Cologne Database for Molecular Spectroscopy (Endres et al. 2016), or any compound with a reasonably accurate prediction of the structure and dipole moment. Since the intensities of rotational transitions can vary over many orders of magnitude, we will work in log(intensity) units and put these natural properties of gases in context with component performances also book-kept in log units.
Our sensitivity model is based on the results of prior work combined with this work and allows for generalization to instrumentation with similar components, such as systems designed for other bands in the millimeter and submillimeter wavelengths. The system sensitivity measurements described in the last section are representative of the sums of component performances (see Tables 1 and 2) and the resonant intensity, within a factor of a few. We sum the component performances to get the system figure of merit (FoM) in log space:
where p(Tx ) is the log of the power from the transmitter in mW; q(C) is log(Q), where Q is the mode quality factor; W is one-tenth of waveguide losses in dB for the modular devices; L(C) is one-tenth of losses of the wires or probes connecting the coupler to waveguide or chip (in dB) [conversion loss for mixers is also factored in here]; L(o) is the log of the optical efficiency; L(Rx ) is one-tenth the conversion loss of the mixer in dB; finally, n(Rx ) is log(Tsys ) where Tsys is the noise floor of the receiver in kelvins. Note that the waveguide, conversion, coupler, and optics losses are expressed as positive values. The one-tenth ratios for inputs in dB units place all units in relative power, and a constant factor (+3.5) in log space allows for unit equivalences across the system components and a result in nTorr nm2MHz. The values derived from component specs or estimated based on ensemble system performances are provided in Table 5. The optics used in these systems have essentially zero reflective or diffractive losses at these quality factors; however, the dual-band alignments typically sacrificed some optical throughput in a single band for the best mutual throughput in both bands; hence, a loss factor of 2 is applied to dual-band systems.
Table 5. Figures of Merit Derived from Component Performances for Our Millimeter-wave Sensors
| Sensor | p(Tx ) | q(C) | W | L(C) | L(o) | n(Rx ) | FoM | FoM* a |
|---|---|---|---|---|---|---|---|---|
| W (old COTS) | 1.6 | 3.7 | 1.1 | 3.5 | 0.0 | 3.0 | 1.2 | ⋯ |
| W (CMOS 90–102) | 0.6 | 3.7 | ⋯ | 1.3 | 0.0 | 3.2 | 3.3 | 3.5 |
| W (new COTS) | 1.3 | 3.2 | 1.1 | 1.2 | 0.3 | 3.0 | 2.4 | 2.7 |
| W (CMOS 77–84) | 0.7 | 3.2 | ⋯ | 1.2 | 0.3 | 3.2 | 2.7 | 2.7 |
| G (COTS) | 1.5 | 3.6 | 1.7 | 1.0 | 0.3 | 3.0 | 2.7 | 2.7 |
| G (CMOS 175–190) | 0.0 | 3.6 | ⋯ | 1.0 | 0.3 | 4.0 | 1.8 | 1.9 |
Note.
a Estimate from measured system sensitivities.Download table as: ASCIITypeset image
Using the FoM and the properties of our components as described earlier, we get FOMs for each system shown in Table 5.
4. Discussion
4.1. Instrument Considerations
In the prior low-SWaP system, all CMOS supporting electronics were resident on a single circuit board, providing an optimal minimal volume for deployment, but not necessarily optimal for consideration of system trades within the electronics. In this effort, to keep a ≤10 cm2 form factor and also double the amount of electronics, we chose to relocate the RF driving support hardware to a second board (called the clock-board). Such a design change introduced inefficiencies (i.e., additional regulators, communications, signal losses along transfer lines), but also allowed for all board-to-board signal transfers to be at 40–150 MHz, a mid-RF range avoiding communications and processor noise. The resulting inter-board connections were successfully kept noise-free with flexible coaxial cabling that did not hinder optical alignment. The demonstration of this architecture bodes well for future flight designs where the clock-board could be assimilated into an FPGA that could allow for these functions as well as IF processing and digitization. It is also relevant to point out that separation of these supporting signals from the active gas-sensing board can allow for minimal electronics exposure in portions of the instrument in challenging environments.
Our prior system design was a first-in-class quasi-optical interface for millimeter waves in a semiconfocal cavity. Provided the real system characterizations of that system, our team set out to optimize and extend the range of this component while maintaining the balance between transmission and isolation and compatibility with neighboring components and structures. The double-slot radiator design chosen maximized transmission and maintained sufficient Q. The design achieves this through a more directional coupling of the entire antenna pattern toward the center of the cavity axis that supports a nodal resonance pattern.
Design simulations of the coupler suggested that a reduction of size to minimize feed-line length could further increase efficiency; however, the placement of four SoC devices in such close proximity on a single circuit board presented other challenges regarding signal routing. Therefore, the ultimate design retained the prior 2 × 2 cm2 size element.
The demonstration of a quartz-based coupling element for the quasi-optical component interface overcomes the ∼150 GHz frequency barrier identified for the prior (Duroid ©) substrate. Quartz is known to efficiently propagate millimeter wave radiation, and our demonstration of this coupling element shows that basic designs are straightforward to implement across the millimeter-wavelength range. Even through quartz is brittle, the flat quartz coupler plates are resilient when mounted onto printed circuit board grounding planes for system integration.
We note that the waveguide probes depicted in Figure 2 developed for our modular system also utilize quartz-based elements with similar purpose. Although these quartz elements are efficient for millimeter-wave applications, there was considerable additional effort to implement the devices, which are quite fragile when stressed during bonding processes. These waveguide-mounted probes occupy small, 3D volumes between narrow channels. To achieve robust, reproducible performance from the quartz coupler elements, several iterations of the supporting structural design, as well as progressive assembly methods, were required. These efficient probes are now in regular use in hybrid (CMOS/GaAs device systems) designs. The performance of these couplers, which are used to transfer millimeter waves from waveguides to the cavity coupler in the modular system, is dramatically better than the first-generation devices used in the first modular system, which was so inefficient no attempt to measure its sensitivity (FoM*) was made.
Table 5 allows a rough inter-comparison of the millimeter wave spectrometers developed thus far. Comparison of the low-SWaP systems at W band reveals a significant drop in the FoM* for the present systems. For G band, some performance limitation was expected due to the limited receiver sensitivity; however, there was no improvement realized at the coupler interfaces; in fact, we estimate interface losses to be 30%–50% worse in the newer system. This factor correlates to technical assembly expertise, which for the low-SWaP 90-102 GHz system had been iterated several times, but for this effort, COVID lab restrictions limited options to a single assembly effort. Conversely, the improvements in the waveguide coupler components for the present modular system place it in family with the low-SWaP CMOS demonstration systems, which now have much fewer lossy elements. For this reason, future efforts could focus on hybrid designs, incorporating both low-SWaP CMOS SoC elements to eliminate massive rack-mounted RF hardware, as well as efficient, modular waveguide-coupled components. Such hybrid systems could overcome CMOS source power, p(Tx ) and/or CMOS receiver noise, n(Rx ) limitations through integration of power, and low-noise-amplifier components to optimize system FoMs.
The prospects for optimized modular systems require a few final design considerations that factor in additional physics and limit the ultimate instrument sensitivity. Both factors have to do with the effects of large power fluxes on system components. The first factor is associated with satisfaction of the Rabi condition, in which the gas-phase molecules are resonant with the pulse of radiation in the cavity. We utilize a cavity to passively amplify the source radiation such that the Rabi condition (and its collapse as an echo signal) can be met within or approximately within the transit time (which limits resolution in our small cavity) of the gas in the active volume. Generally, we have found that only molecules with small dipole moments (<0.5 D) are insufficiently pumped where the increases in source power and/or cavity quality factor produce better pulse echo signals due to shortening of the pulse time and corresponding lengthening of the echo and/or transit time (3–10 μs) overlap. We have experimented with the modular system and found that increasing p(Tx ) in W band with the present Q-factors, does not improve the system performance except for the weakest dipole gases. The second factor has to do with large signal saturation of the receiver system, which was observed in the G-band systems. Here the strongest excitation signals from the transmit pulse and/or gas echo contribute to shot noise observable in the receiver baseline. This noise, when contributed by a large echo signal, reduces the gain in S/N that would be associated with the positive terms in Equation (1).
On a final note regarding the instrument sensitivity, some comparison can be made to millimeter and submillimeter instrumentation developed for quantitative chemical analyses (e.g., Medvedev et al. 2010; Lou et al. 2019). These techniques have utilized absorption methods, which require frequency sweep methods to determine the transmission background. The sensitivity achieved in absorption by Lou et al. (2019), with a gas cell about the volume of our entire system, is comparable to our values, albeit with larger SWaP and less acquisition speed; for example, Lou et al. (2019) states LoD for CO of 80 μTorr, N2O of 32 μTorr, and OCS of 10 μTorr, the latter two of which are directly comparable to our systems, i.e., 130 μTorr for N2O (Nemchick et al. 2018a) and <10 μTorr for OCS (this work; W band). The cavity-enhanced absorption methods in the submillimeter wavelengths such as Hindle et al. (2019), Elmaleh et al. (2023) are more sensitive than the millimeter-wave methods, but not yet compact, and likely to be less robust for our goals that include operability in extreme environments.
4.2. Mission Applicability
The success of the development of a modular (hybrid) system that enables an efficient coupling from the waveguide into the cavity has brought into focus the engineering required for making robust, flight-quality designs. Figure 7(a) shows a concept for separated transmitter and receiver elements combined in a waveguide-coupler interface similar to ours but back-fed to allow a more deployable form factor (envisaged here within 7 cm distance rods). Such a system could take advantage of the low power CMOS elements without adding the complexity and risk associated with placement and performance of all four elements onto one circuit board. This concept also eliminates most of the circuitry from immediate exposure to the external environment where gas sensing is done. In this section, we briefly consider the utility of such a system in a few extraterrestrial environments.
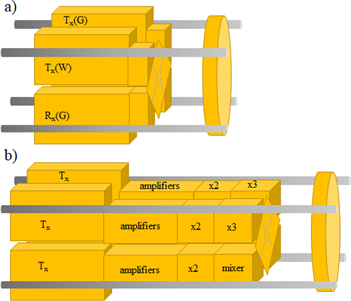
Figure 7. Waveguide connected hybrid CMOS systems envisaged for flight mission efforts.
Download figure:
Standard image High-resolution imageThe surface environment of Mars is characterized by a thin carbon-dioxide-dominated atmosphere that contains poisonous and caustic trace gases such as carbon monoxide (CO) and hydrogen peroxide (H2O2) as well as potentially useful gases such as dioxygen (O2) and water vapor. The orbital measurements of CO and water vapor have shown the concentrations vary with season, latitude, and altitude; meanwhile, the surface measurements have required recalibration (e.g., Franz et al. 2015). Millimeter-wave sensing of these gases could be accomplished with the 183 GHz band described here combined with a system tuned to the low end of F band (110–140 GHz). Using CO measurements and global chemical models (Daerden et al. 2019), we can estimate surface abundances and infer the potential for local point measurements of these compounds with a millimeter-wave semiconfocal cavity system. These are combined with catalog values for millimeter-wavelength resonances of these gases to produce the detection limits (in 1 s), S/N values, and estimated integration times, reported in Table 6. We conclude that the system developed already could make meaningful measurements of CO, O2, and H2O on the Martian surface with fidelity to observe both short-term and long-term trends in weather and climate. For H2O2, the integration times of many minutes are required to observe the expected low abundances of this corrosive gas. With these measurements, Martian-landed missions could monitor photolytic surface activity and evaluate the atmospheric redox potential.
Table 6. Estimates of Signal-to-noise Ratios for Martian Trace Gases
| Gas | Est. vmr a , b | Frequency | Iab | LoD | S/N | τ |
|---|---|---|---|---|---|---|
| (GHz) | nm2MHz | μTorr | (1 s) | s | ||
| CO | 7.5 × 10⁻⁴ | 115 | 10−5.0 | 200 | 26 | ≤1 |
| H2O2 | 4.0 × 10⁻⁸ | 116 | 10−3.0 | 2 | 0.1 | 460 |
| O2 | 1.0 × 10⁻³ | 118 | 10−6.1 | 2500 | 2.8 | ∼1 |
| H2O | 1.0 × 10⁻⁴ | 183 | 10−3.6 | 50 | 15 | ≤1 |
Notes. The limit of detection (LoD) in 1 s is FoM/Iab ; integration time to establish 3σ detection is denoted τ. We assume a base pressure of 7 Torr and do not account for pressure broadening, which may decrease sensitivities by a factor of 3 to 5.
a Franz et al. (2015). vmr = volume-mixing ratio. b Daerden et al. (2019).Download table as: ASCIITypeset image
Next, we consider deployment of a DHR capable system to an icy body such as a comet, Europa, Ganymede, Encelaus, or Triton. Each of these objects could be interrogated geologically with a drilling system in which a millimeter-wave gas analyzer records quantitative composition of evolved volatiles. For this mission architecture, the gas probing cavity region is exposed to space near the drill platform (see Figure 8), allowing thermalized vapors and drilling exhaust to pass through the system. The first measurements are done during the landing when water and deuterated water are measured upon contact as the warm spacecraft induces evaporation of the near-surface materials. The millimeter-wave system captures this transient event and quantifies its temporal signature (how long) as well as the material mass (how much), and finally a measurement of the near-surface DHR (how old). This initial measurement is valuable for science as well as reconnaissance for sampling during later drilling. It provides an initial estimate of DHR to determine appropriate integration times during drilling, but also provides an estimate of the material properties based on modeling of the temporal and mass signatures. During drilling, the system monitors DHR and other escaping volatiles for the quantification of lost sample components, mitigating the risks associated with cryogenic drilling operations. If drilled samples are to be sent on a return mission, the millimeter-wave system remains for in situ probing of the surface as long as mission resources permit, returning detailed inventories of volatiles naturally outgassed from the surface.

Figure 8. Artist rendition of a low-SWaP system deployed next to a drill affixed to the side of a Philae-like comet landing craft (Di Lizia et al. 2016). Immersion of the open cavity structure in the plume allows for instantaneous monitoring of lost volatiles during sampling.
Download figure:
Standard image High-resolution image
Note that pairing with a drill is not the only mechanism for volatile sensing; even though the vapor pressure of water and its isotopologues are strongly temperature dependent, there is natural volatility on the surfaces of icy bodies. For water, expected to be the bulk constituent of most icy bodies (Pinto et al. 2022), the instrumentation developed in this work is sensitive to vapor pressures over ice. The comets near perihelion easily exceed this surface temperature under solar illumination (Tosi et al. 2019). The capability is exemplified in the modular system data of Figure 4 that were taken in the headspace of a controlled ice sample. As predicted by the room-temperature sensitivity determinations, the modular system exhibited signals above the noise floor once the vapor pressures exceeded 50 μTorr (at around 180 K). In cometary environments, water outgassing appears to follow predictable trends in solar illumination and surface heating (Fink et al. 2016; Tosi et al. 2019) where a hypersensitivity to solar illumination was found for the more volatile CO2 outgassing. Other evolved high-volatility compounds that could be measured include methanol, carbon monoxide, and hydrogen peroxide. With a landed sensor for measuring evolved volatiles that is mobile [a rover or climber robot; Uckert et al. 2020], we envisage investigations into landscape-specific composition where DHR and trace gas content are probed in multiple surface environments to examine the likelihood for nascent versus redeposited materials (how old) and to determine if photolytic activities are occurring in near-surface ices.
5. Conclusions
Building on the success of the development of a CMOS-based FTmmw system, this effort demonstrates dual-band capabilities in one compact system and significantly impacts the desire for and utility of a small, deployable sensor by providing high-value science targets in water and DHR. The effort is notable also for demonstrating the ability to target specific gases, taking future targeting efforts out of the realm of technology development and into standard engineering. Although water is the highest-value target, the compact systems are demonstrated to target many volatiles and can thus be envisaged for a wide variety of applications. Potential flight concepts utilizing millimeter-wavelength gas sensors are now realizable without further component technology demonstrations.
Recognizing the hybrid systems enabled by the waveguide probes allows for CMOS/GaAs systems to be designed and built; we envisage also straightforward engineering extensions of this technique to ranges in the submillimeter wavelengths were water, deuterated water, methanol, hydrogen peroxide, and oxygen, and many other 2–3 heavy atom volatiles have significantly stronger resonances. The back-fed coupler design shown in Figure 7(b) envisages CMOS transmitters (Tx
) feeding GaAs components for multiplication and heterodyne reception at 540–600 GHz. At this range, H2O (556 GHz, Iab = 10−0.8),  (548 GHz, Iab = 10−0.8),
  (552 GHz, Iab = 10−0.8), and HDO (599 GHz, Iab = 10−1.1) all have resonances nearly 300–1000x stronger than those at millimeter wavelengths. A dual-band system with a mirror that has an adjustable radius of curvature could monitor two of these resonances simultaneously and provide sensitivities in the 10 s of nTorr range where naturally occurring amounts of rare isotopes would be measurable without signal averaging, or the ultra-low vapor pressures at the surfaces of Ganymede or Europa could be monitored.
The work described in this paper was performed at the Jet Propulsion Laboratory, California Institute of Technology, with support from the National Aeronautics and Space Administration under grant No. 80NM0018F0613 issued by the Planetary Science Division PICASSO program, © 2023. All rights reserved.