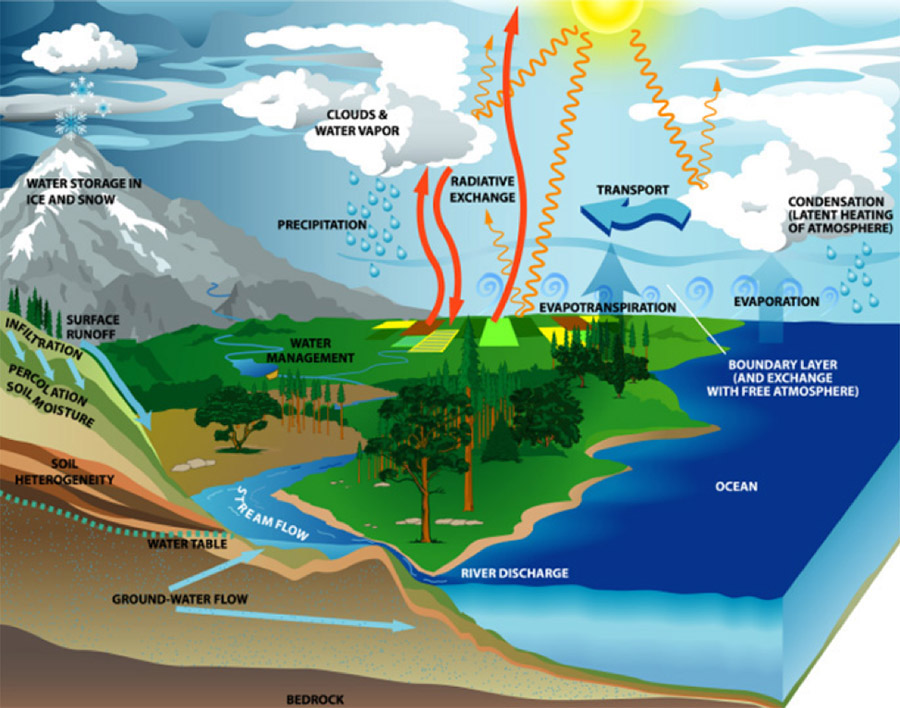
The complete water cycle includes evaporation from oceans and land which is then transported by the atmosphere, together with a small fraction from plant transpiration and from ice sublimation, and precipitates over ocean and land surfaces as rain, snow, freezing rain, sleet, hail, or graupel (graupel is soft hail or snow pellets, precipitation that forms when supercooled water droplets freeze on falling snowflakes). Liquid precipitation over land, joined by melted snow or ice, either penetrates the soil towards aquifers, runs off back to the ocean as rivers, or evapotranspirates back to the atmosphere. A fraction of the water that penetrated the soil also ends up in the ocean as submarine groundwater discharge. Thus the complete water cycle involves the oceans, land, atmosphere, biosphere, and cryosphere. (See below a depiction of Earth’s water cycle; read more about it at NASA’s Earth Observatory website.)
This section focuses on JPL studies of the terrestrial components of the water cycle and highlights how the work of JPL scientists spans various lifecycle stages of satellites missions.
Current Challenges
Water cycle research at the Jet Propulsion Laboratory is geared towards answering the following questions:
- How is Earth’s water cycle changing and what are the implications for hydrologic extremes and water availability?
- To what extent are human activities, especially water management, driving regional and global changes in the water cycle? What are the processes driving water cycle acceleration?
- How does terrestrial water storage modulate heat storage and sea level rise?
We address these challenges by observing and understanding total land water storage, soil moisture, surface water (rivers and lakes), and snow.
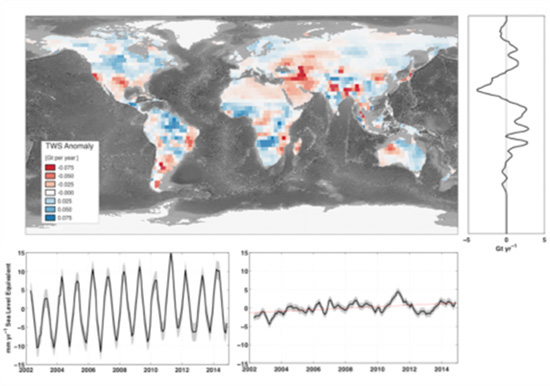
Total water storage and GRACE
The Gravity Recovery And Climate Experiment (GRACE) mission measured changes in Earth’s gravity field from 2002 to 2017. Its successor GRACE Follow-On (GRACE-FO) was launched in 2018 and will provide similar measurements. Because water is heavy (1000 kg, or one metric ton, per cubic meter!), the movements of water on Earth can be tracked through changes in Earth’s gravity felt from orbit. Given the extensive 15+ year data record from GRACE, JPL scientists have been able to discover answers to Earth’s water cycle mysteries, including why the increase in sea level appeared to have slowed down: much of the precipitation destined to oceans was temporarily stored on land. Other JPL studies, also using GRACE, have shown decreased groundwater availability in several regions, and the conditions setting the stage for drought or flood.
Soil moisture and SMAP
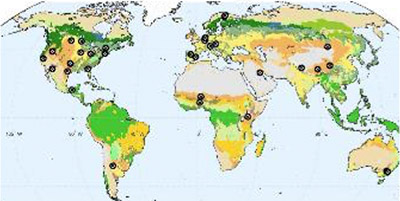
The Soil Moisture Active Passive (SMAP) mission was launched in 2015 and successfully measures changes in soil moisture around the world. Given that the time range of data from SMAP is still relatively short, much effort has gone into interpreting the SMAP data together with measurements on the ground.
Over one-third of the global land area undergoes a seasonal transition between predominantly frozen and non-frozen conditions each year, with the land surface freeze/thaw (FT) state a significant control on hydrological and biospheric processes over northern land areas and at high elevations. Initial data from SMAP’s radar also captured the 2015 spring thaw progression over the Northern Hemisphere, with a thaw front extending from predominantly non-frozen southern latitudes to the still-frozen north (Derksen, Xu, Dunbar, et al., 2017). This kind of work links the water and carbon cycles.
SMAP is also able to measure ocean salinity, which enabled JPL-led studies to focus on both sides of the land/sea continuum. Fournier, et al. (2016) presented the first such two‐sided analysis, focusing on the May 2015 severe flooding in Texas. Their investigation benefited from simultaneous measurements of land surface soil moisture and sea surface salinity, both from SMAP, as well as ancillary data.
Surface Water and SWOT
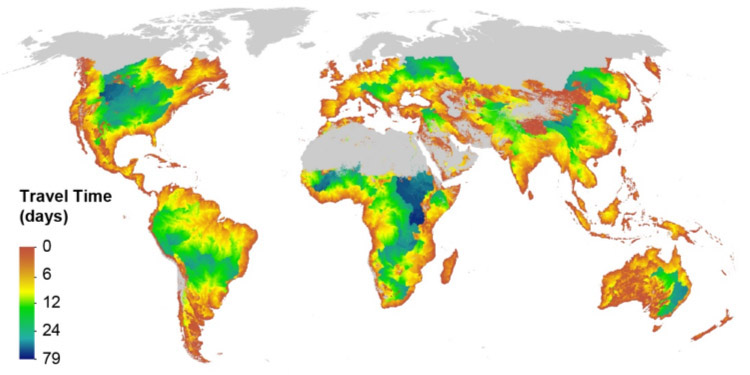
The Surface Water and Ocean Topography (SWOT) mission is the first satellite mission specifically designed to observe the rivers and lakes on Earth’s continents. SWOT is currently expected to launch in late 2021 and JPL scientists are working to help with satellite design decisions in order to guarantee the best return on investment for NASA. An example of this is an effort to quantify see how fast SWOT data will need to be made available to users so they can track conditions that quickly change, like water moving through Earth’s rivers.
Snow and ASO
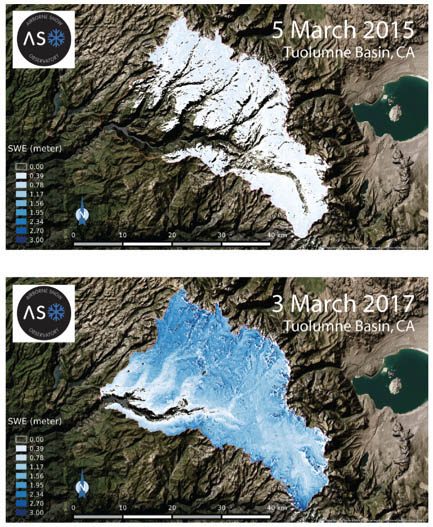
Understanding the amount of water stored as snow in mountains is critical for water managers, particularly for the cities that are located downstream of these mountains. As NASA investigates potential designs for future Earth orbiting satellites to observe snow, JPL scientists are studying potential measurement strategies using airplanes before using spacecrafts. The Airborne Snow Observatory (ASO, Painter, Bormann et al, 2017) is an example of such a strategy to measure snowpack.